graphrag
Visualizing and Debugging Your Knowledge Graph
The following step-by-step guide walks through the process to visualize a knowledge graph after it’s been constructed by graphrag. Note that some of the settings recommended below are based on our own experience of what works well. Feel free to change and explore other settings for a better visualization experience!
1. Run the Pipeline
Before building an index, please review your settings.yaml configuration file and ensure that graphml snapshots is enabled.
snapshots:
  graphml: true
(Optional) To support other visualization tools and exploration, additional parameters can be enabled that provide access to vector embeddings.
embed_graph:
  enabled: true # will generate node2vec embeddings for nodes
umap:
  enabled: true # will generate UMAP embeddings for nodes, giving the entities table an x/y position to plot
After running the indexing pipeline over your data, there will be an output folder (defined by the storage.base_dir setting).
- Output Folder: Contains artifacts from the LLM’s indexing pass.
2. Locate the Knowledge Graph
In the output folder, look for a file named graph.graphml. graphml is a standard file format supported by many visualization tools. We recommend trying Gephi.
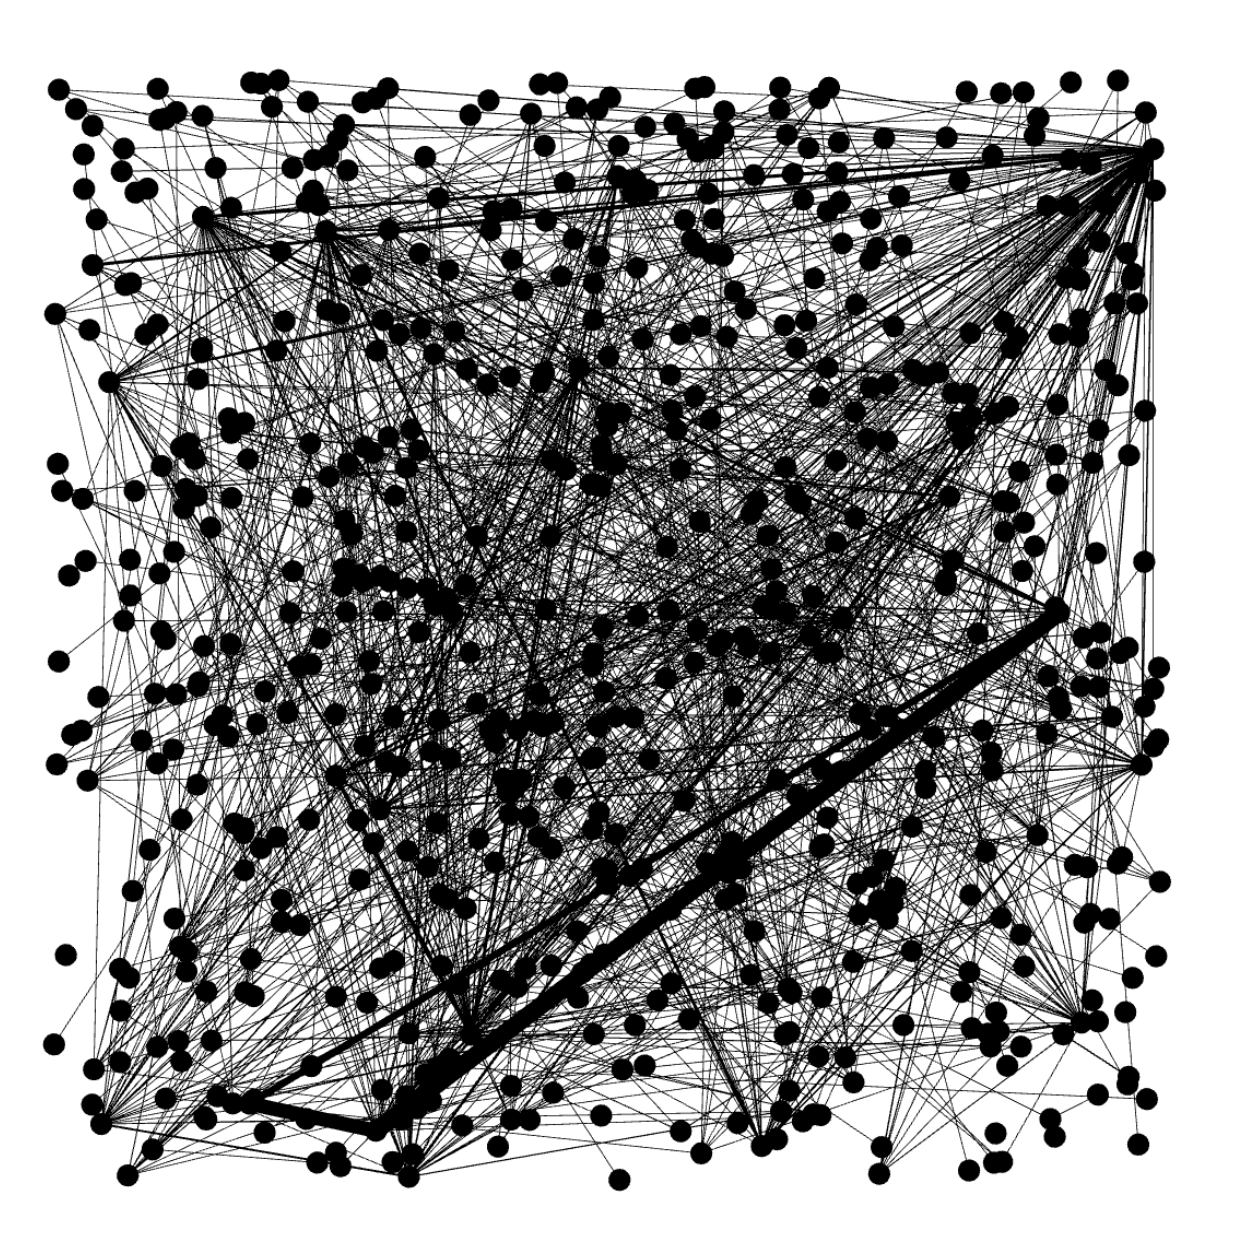
3. Open the Graph in Gephi
- Install and open Gephi
- Navigate to the
outputfolder containing the various parquet files. - Import the
graph.graphmlfile into Gephi. This will result in a fairly plain view of the undirected graph nodes and edges.
4. Install the Leiden Algorithm Plugin
- Go to
Tools->Plugins. - Search for “Leiden Algorithm”.
- Click
Installand restart Gephi.
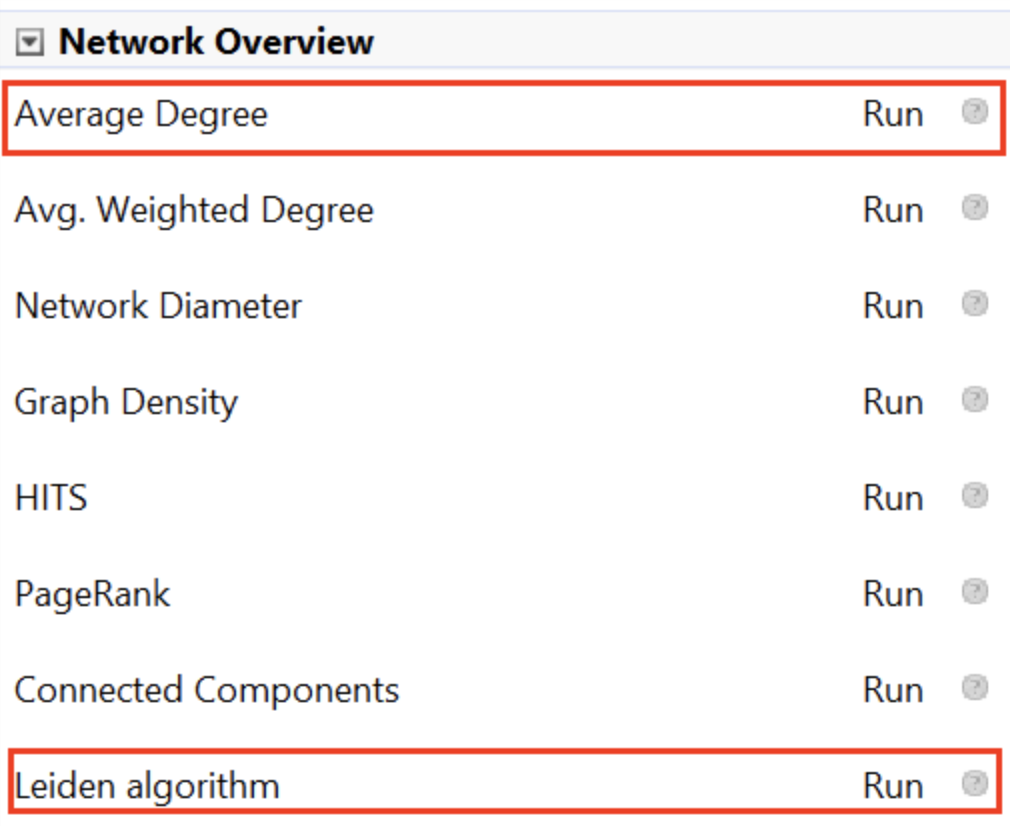
5. Run Statistics
- In the
Statisticstab on the right, clickRunforAverage DegreeandLeiden Algorithm.
- For the Leiden Algorithm, adjust the settings:
- Quality function: Modularity
- Resolution: 1
6. Color the Graph by Clusters
- Go to the
Appearancepane in the upper left side of Gephi.
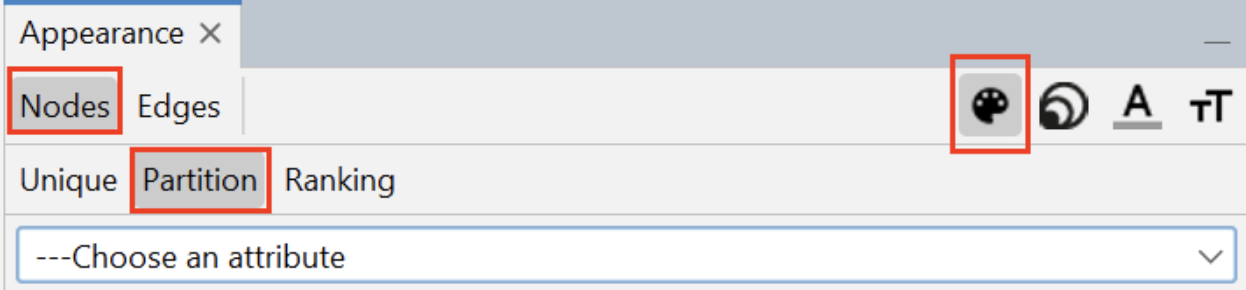
- Select
Nodes, thenPartition, and click the color palette icon in the upper right. - Choose
Clusterfrom the dropdown. - Click the
Palette...hyperlink, thenGenerate.... - Uncheck
Limit number of colors, clickGenerate, and thenOk. - Click
Applyto color the graph. This will color the graph based on the partitions discovered by Leiden.
7. Resize Nodes by Degree Centrality
- In the
Appearancepane in the upper left, selectNodes->Ranking - Select the
Sizingicon in the upper right. - Choose
Degreeand set:- Min: 10
- Max: 150
- Click
Apply.
8. Layout the Graph
- In the
Layouttab in the lower left, selectOpenORD.
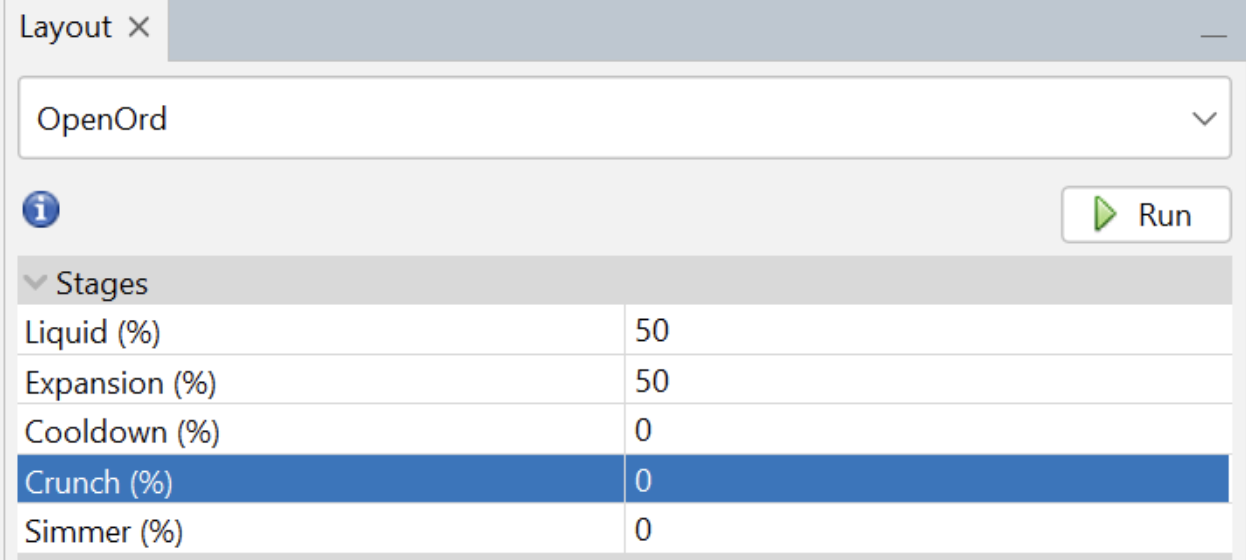
- Set
LiquidandExpansionstages to 50, and everything else to 0. - Click
Runand monitor the progress.
9. Run ForceAtlas2
- Select
Force Atlas 2in the layout options.
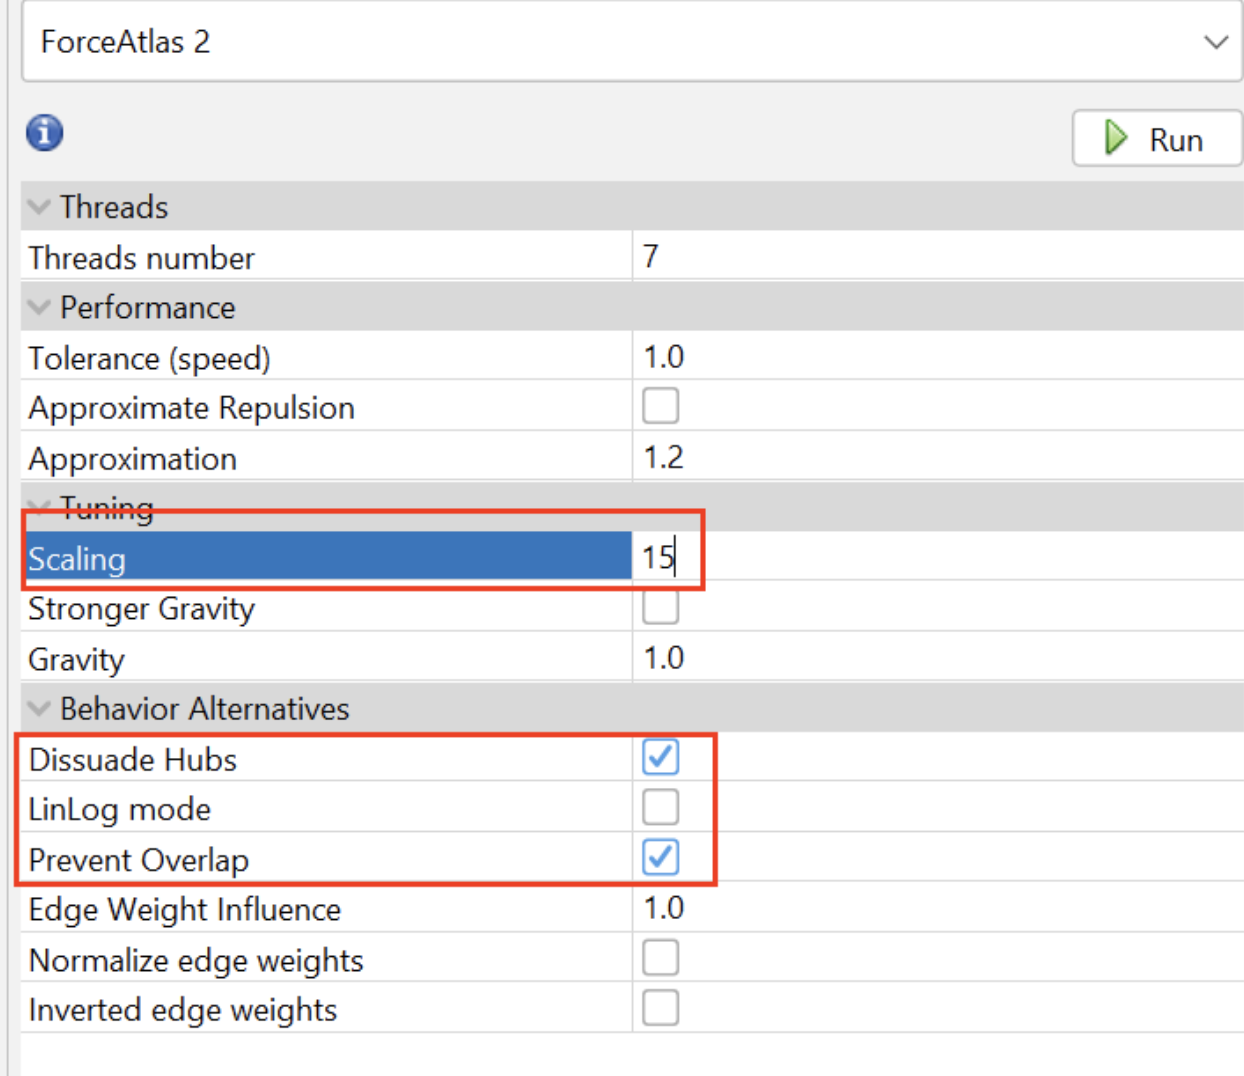
- Adjust the settings:
- Scaling: 15
- Dissuade Hubs: checked
- LinLog mode: uncheck
- Prevent Overlap: checked
- Click
Runand wait. - Press
Stopwhen it looks like the graph nodes have settled and no longer change position significantly.
10. Add Text Labels (Optional)
- Turn on text labels in the appropriate section.
- Configure and resize them as needed.
Your final graph should now be visually organized and ready for analysis!